Your Guide to Refrigerant Pressure Temp Charts
Your Guide to Refrigerant Pressure Temp Charts
Your Guide to Refrigerant Pressure Temp Charts
Master the refrigerant pressure temp chart. This guide explains how to read and use PT charts for system diagnosis, charging, and ensuring HVAC efficiency.
Master the refrigerant pressure temp chart. This guide explains how to read and use PT charts for system diagnosis, charging, and ensuring HVAC efficiency.
Master the refrigerant pressure temp chart. This guide explains how to read and use PT charts for system diagnosis, charging, and ensuring HVAC efficiency.
August 8, 2025
A refrigerant pressure-temp chart is one of the most fundamental tools in an HVAC technician's arsenal. At a glance, it maps out the precise relationship between a refrigerant's pressure and its boiling point, which we call its saturation temperature. Technicians depend on these charts for everything from charging a system correctly to diagnosing tricky performance issues and verifying overall efficiency.
How to Read a PT Chart
Think of a PT chart as your decoder ring for what's happening inside the sealed refrigerant circuit. It takes the complex laws of thermodynamics and makes them practical for fieldwork. The core principle is simple: for any given refrigerant, if you know its pressure while it's in a saturated state (a mix of liquid and vapor), you know its exact temperature. The reverse is also true.
This connection is the bedrock of professional diagnostics. Trying to service a system without this data is like flying blind; you’re just guessing. The chart is what allows us to calculate superheat and subcooling—the two most vital signs of a system's health. These calculations tell you whether the refrigerant charge is correct and if critical components like the expansion valve and compressor are doing their job.
Key HVAC Terms and Definitions
Before we dive deeper into using the chart, you need to be comfortable with a few key terms. Each one describes a specific state or process happening to the refrigerant inside the system. Getting these concepts down is the first step to making accurate calculations and diagnoses.
Pro Tip: Always double-check that you're using the PT chart that matches the exact refrigerant in the system. Using an R-22 chart for an R-410A system, for example, will throw off all your readings and could lead to misdiagnosis or even equipment damage.
Here's a quick-reference table of the terms you'll see again and again.
Term | Definition |
|---|---|
Saturation | This is the state where refrigerant is actively changing from a liquid to a gas (boiling) or a gas to a liquid (condensing). In this state, both liquid and vapor are present at the same temperature and pressure. |
PSIG | Stands for Pounds per Square Inch Gauge. It's the pressure reading relative to the atmosphere around you and is the standard measurement you'll see on your HVAC manifold gauges. |
Superheat | This is the temperature added to the refrigerant vapor after all the liquid has boiled off. Measuring superheat confirms the evaporator coil is working efficiently and protecting the compressor from liquid. |
Subcooling | This is the temperature removed from the refrigerant liquid after all the vapor has condensed. A proper subcooling reading ensures a solid stream of liquid is being delivered to the metering device. |
Getting a firm grasp on these definitions is non-negotiable for anyone working in the field. They are the language of refrigeration, and we'll be applying them in practical scenarios throughout this guide.
The Science Behind Refrigeration and PT Charts
At its core, a refrigerant pressure-temperature chart is a cheat sheet for the laws of thermodynamics in action. It’s the tool that lets us peek inside an AC or refrigeration system and see what’s really going on. The entire chart is built on one simple, reliable principle: for a given refrigerant, its boiling point is directly tied to its pressure. Change one, and the other changes in a predictable way.
This relationship is the foundation of how these systems move heat. The real work gets done during the phase change—when the refrigerant turns from a liquid to a gas and back again. This continuous process, known as the vapor-compression cycle, is what allows an air conditioner to absorb heat from inside your house and dump it outside.
The Four Stages of the Refrigeration Cycle
Every system, from a small window unit to a massive commercial chiller, runs on this same four-stage cycle. A PT chart is your go-to reference for two of these stages—the ones where the magic of phase change happens.
Evaporation: This is where the cooling happens. Inside the evaporator coil (the indoor unit), the cold, low-pressure liquid refrigerant boils. As it boils, it absorbs a massive amount of heat from the indoor air, turning from a liquid into a gas. Your PT chart tells you the exact temperature this should be happening at based on your low-side pressure reading.
Compression: Now a low-pressure gas, the refrigerant travels to the compressor. The compressor, as the name implies, squeezes this gas, which dramatically increases its pressure and, as a result, its temperature. It leaves the compressor as a very hot, high-pressure, superheated vapor.
Condensation: This hot gas then flows to the condenser coil (the outdoor unit). Here, it releases all the heat it picked up inside. As it cools down to its saturation point, it condenses back into a high-pressure liquid. Once again, the PT chart confirms the exact temperature this phase change should occur at, based on your high-side pressure reading.
Expansion: Finally, this high-pressure liquid passes through an expansion device. This device acts like a nozzle, causing a sudden drop in pressure and temperature. The refrigerant is now a cold, low-pressure liquid, ready to head back to the evaporator and start the whole process over.
It's this constant cycle of boiling and condensing that makes cooling possible. The PT chart is indispensable because it gives you a direct, accurate link between a refrigerant's saturation pressure and its corresponding saturation temperature. Classic charts list vapor pressure in psig alongside temperature, built on the idea that single-component refrigerants have one specific boiling point for any given pressure. For a deeper dive into how this all works together, you can find some great refrigeration cycle insights from APC.com.
How to Read and Apply a PT Chart Accurately
Think of a refrigerant pressure-temperature chart as your map to a system's inner workings. It's an indispensable tool, but only if you know how to read it right. Get this wrong, and your entire diagnosis can go sideways. The process itself is pretty straightforward: you take one known value—either pressure from your gauges or a temperature you've measured—and use the chart to find its corresponding state.
First things first, make sure you're looking at the right chart for the refrigerant in the system you're servicing. A chart for R-22 is useless if the unit runs on R-410A. Once you’ve got the right one, hook up your gauges. Let's say you get a low-side pressure reading. Find that pressure (in PSIG) on the chart, and the temperature right next to it is the refrigerant's saturation temperature—the exact point where it’s boiling off inside the evaporator.
This simple cross-reference is the foundation of almost every diagnostic you'll perform. It lets you confirm if the system is hitting the saturation points it should be. For instance, if you know the target evaporator temperature should be hovering around 40°F, the chart will tell you the precise low-side pressure you should be seeing on your gauges to make that happen.
From Saturation to Superheat and Subcooling
Finding the saturation temperature is just step one. The real diagnostic magic happens when you use that number to calculate superheat and subcooling. These two values are the most critical vital signs for any vapor-compression system, telling you what the refrigerant is doing after it has finished changing state.
Superheat and subcooling aren't just abstract numbers; they're direct clues to system efficiency and component health. The wrong superheat can scream "undercharged system" or "bad TXV," while incorrect subcooling often points to an overcharge or a liquid line restriction.
To get these crucial figures, you'll compare the saturation temperature from the chart with an actual temperature you measure on the refrigerant lines. Here’s how you do it for both.
Quick Lookup for Common Refrigerant Saturation Points
For a quick reference on the job, it helps to have a few common saturation points memorized. This table shows the relationship for some of the most common refrigerants you'll encounter at typical operating temperatures. It's a great example of how you can use a full PT chart for a fast gut check in the field.
Refrigerant | Saturation Temperature (°F) | Corresponding Pressure (PSIG) |
|---|---|---|
R-410A | 40°F | ~118 PSIG |
R-134a | 35°F | ~30 PSIG |
R-22 | 45°F | ~76 PSIG |
R-404A | 10°F | ~48 PSIG |
This kind of quick lookup helps you immediately spot if a pressure reading is way out of the expected range, prompting a deeper investigation.
Calculating Superheat
Measure Suction Line Pressure: Hook up your low-side gauge to the suction port near the compressor and note the pressure in PSIG.
Find Saturation Temperature: Look up that pressure on your refrigerant pressure temp chart to find the corresponding boiling temperature.
Measure Suction Line Temperature: Using a good quality pipe clamp thermometer, measure the temperature on the suction line at the exact same spot you took the pressure reading.
Do the Math: Subtract the saturation temperature (from the chart) from the actual line temperature you measured. The result is your superheat.
Example:
You're working on an R-410A system and your low-side gauge reads 118 PSIG.
The PT chart tells you the saturation temp for 118 PSIG is 40°F.
Your pipe clamp on the suction line reads 50°F.
The calculation: 50°F (actual temp) - 40°F (saturation temp) = 10°F of Superheat.
Calculating Subcooling
Measure Liquid Line Pressure: Attach your high-side gauge to the liquid line service port and record the pressure.
Find Saturation Temperature: Use your PT chart to find the saturation (condensing) temperature that corresponds to that high-side pressure.
Measure Liquid Line Temperature: Clamp your thermometer onto the liquid line, again, as close as possible to the service port.
Do the Math: This time, you subtract the actual line temperature you measured from the saturation temperature on the chart. That value is your subcooling.
Following this methodical process turns a simple refrigerant pressure temp chart from a static reference sheet into a powerful, active diagnostic tool. Getting these fundamental readings right is the key to effective service, whether you're troubleshooting a charge or confirming the performance of system components like pressure transducers and metering devices.
Using PT Charts for Real-World HVAC Diagnostics
A refrigerant pressure-temperature chart stops being just a reference document and becomes one of your most powerful diagnostic tools the second you hook up your gauges in the field. Knowing the theory is one thing, but applying that chart to figure out what's really going on inside a struggling system is what separates the pros from the newcomers. Armed with your manifold gauges and a good thermometer, the PT chart helps you uncover the hidden story of a system's health.
The process itself is straightforward and incredibly reliable. For any given pressure, the chart tells you the exact temperature at which that refrigerant should be boiling or condensing—its saturation point. When you compare that expected temperature to the actual temperatures you measure on the system's lines, the difference tells you everything you need to know.
This simple workflow is the core of refrigerant-side diagnostics.
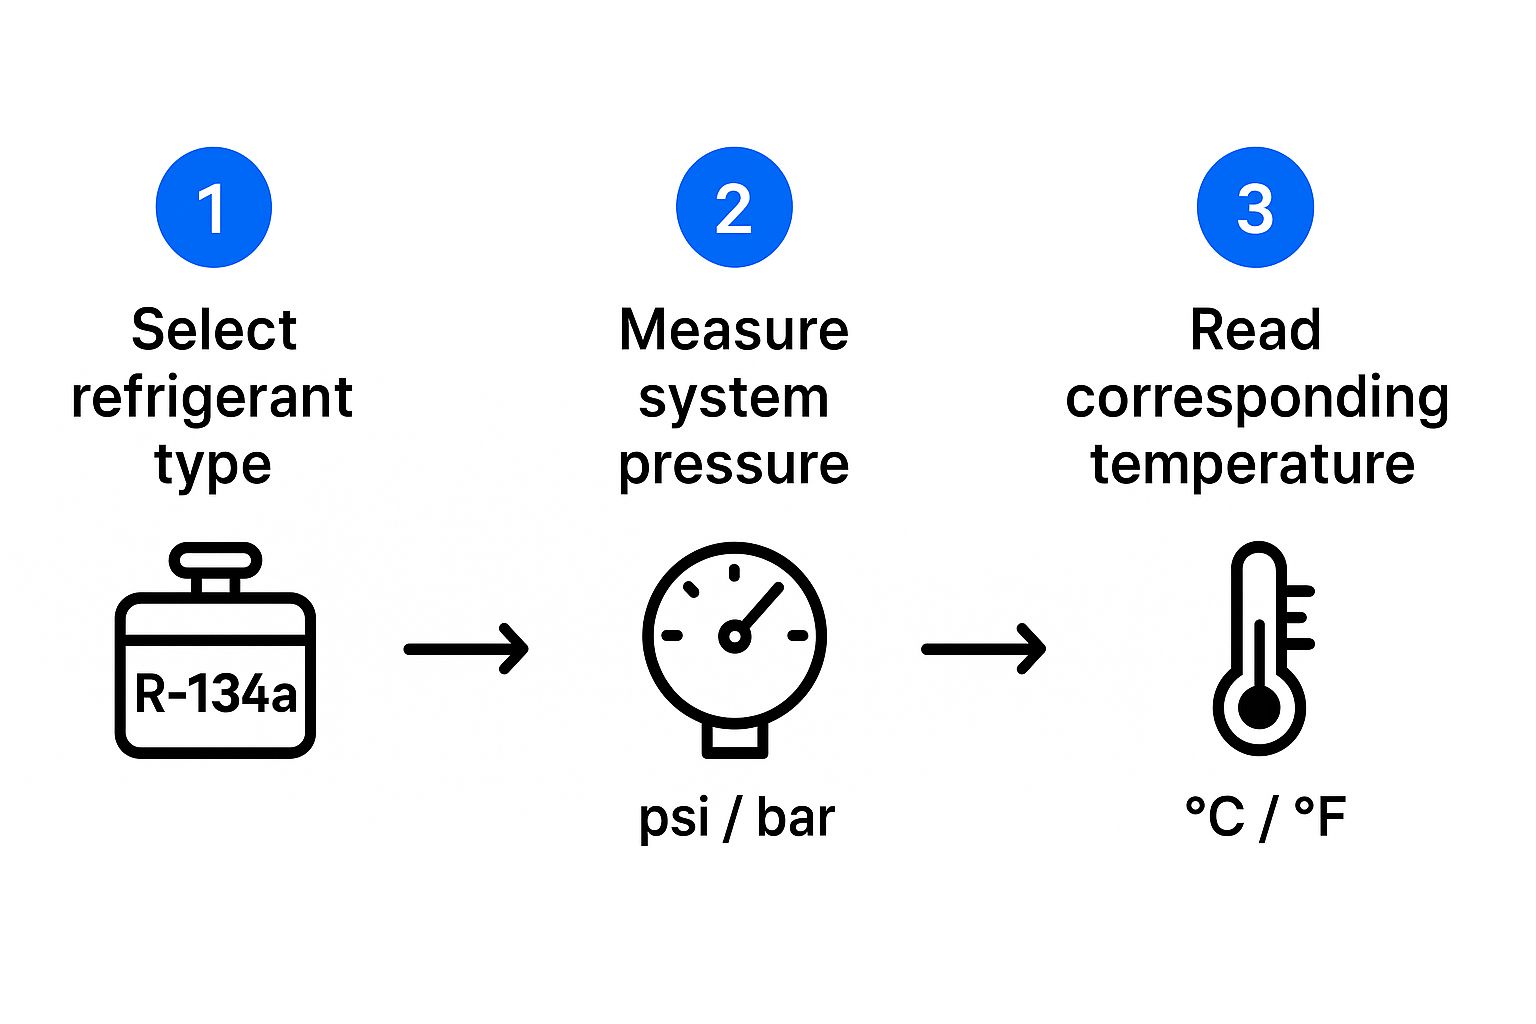
As the infographic shows, it all starts with identifying the refrigerant. From there, you take a pressure reading, find the corresponding saturation temperature on your chart, and use that value as the baseline for all your other checks.
Calculating Superheat to Diagnose System Performance
Superheat is your window into what's happening in the evaporator coil. It tells you how efficiently the coil is absorbing heat and, just as importantly, whether you're sending safe, vapor-only refrigerant back to the compressor. If your superheat is off, it's a major red flag, almost always pointing to an incorrect refrigerant charge or a problem with the metering device.
To find it, you just need to compare the evaporator's boiling point (which you get from the PT chart) with the actual temperature of the vapor leaving the coil.
Example Scenario: An Undercharged System
Refrigerant: R-410A
Low-Side Pressure: You hook up your gauges and get a reading of 100 PSIG on the suction line.
Chart Value: A quick look at your R-410A PT chart shows that 100 PSIG equates to a saturation (boiling) temperature of 32°F.
Actual Temperature: You place your pipe clamp thermometer on the suction line near the outdoor unit and get a reading of 55°F.
Calculation: 55°F (Actual Temp) – 32°F (Saturation Temp) = 23°F of Superheat.
A superheat of 23°F is almost always too high. It's a classic sign that there isn't enough liquid refrigerant boiling in the evaporator to effectively absorb heat, strongly suggesting the system is undercharged or has a leak.
Calculating Subcooling to Find Charge and Flow Issues
Subcooling, on the other hand, tells you about the state of the refrigerant in the liquid line. It confirms whether the condenser successfully removed enough heat to turn all the high-pressure vapor into a solid column of liquid. An incorrect subcooling value often means you're dealing with an overcharge or a restriction somewhere before the metering device.
A proper subcooling reading is absolutely critical. Without a solid stream of liquid refrigerant, the expansion valve can't feed the evaporator correctly. This starves the coil, leading to poor performance and even component damage down the line.
Example Scenario: An Overcharged System
Refrigerant: R-410A
High-Side Pressure: Your high-side gauge reads 418 PSIG.
Chart Value: Your PT chart shows that a pressure of 418 PSIG corresponds to a saturation (condensing) temperature of 120°F.
Actual Temperature: You measure the liquid line temperature right before it enters the building and get 100°F.
Calculation: 120°F (Saturation Temp) – 100°F (Actual Temp) = 20°F of Subcooling.
A subcooling of 20°F is significantly higher than the typical manufacturer's target (which is usually around 10–12°F). This excess cooling means refrigerant is stacking up in the condenser instead of flowing through the system—the textbook definition of an overcharge.
Getting comfortable with these quick calculations is key. It's the same fundamental data that more advanced tools, like pressure chart recorders, use to track and log system performance over time.
Understanding Blends and Temperature Glide on Modern PT Charts

If you've been in the trade for a while, you know that reading a PT chart for a single-component refrigerant like R-22 is second nature. But today’s systems often run on zeotropic blends, like R-407C, which behave differently. To get accurate readings with these, you have to master a new concept: temperature glide.
A pure refrigerant boils and condenses at one specific temperature for a given pressure. A zeotropic blend, however, changes state across a range of temperatures. This phenomenon is what we call temperature glide, and it can span anywhere from 1°F to over 5°F.
This happens because the different components within the blend boil and condense at slightly different rates, a process known as fractionation. The result? Modern PT charts for blends need two separate columns for saturation temperature—one for the dew point (vapor) and one for the bubble point (liquid). You can find a deeper dive into how refrigerant blends work at APC.com to learn more about the science behind it.
Put simply, at a single pressure inside the evaporator coil, the refrigerant starts boiling at one temperature and doesn't finish until it reaches a higher one. This is exactly why you'll see two temperature columns next to each pressure reading on a modern chart.
Bubble Point vs. Dew Point
So, which temperature do you use? Getting this wrong is a fast track to miscalculating your superheat or subcooling, leading you to a completely flawed diagnosis. It’s critical to match the right value to the state of the refrigerant.
Bubble Point: This is the temperature where the liquid refrigerant starts to boil. Think of it as the "saturated liquid" temperature. It will always be the lower of the two temperature values on the chart.
Dew Point: This is the temperature where the last bit of refrigerant vapor finally condenses into a liquid. This is your "saturated vapor" temperature and will always be the higher of the two values.
There’s a simple rule of thumb that you absolutely have to remember: always use the temperature that matches the state of the refrigerant after the phase change is complete.
Here’s how that plays out in the field:
For Superheat: You measure superheat on the suction line, where the refrigerant should be 100% vapor. Therefore, you must use the Dew Point (vapor saturation) temperature from your PT chart.
For Subcooling: You measure subcooling on the liquid line, where the refrigerant should be 100% liquid. For this, you have to use the Bubble Point (liquid saturation) temperature.
A Brief History of Refrigerants and Their Charts
The pressure-temperature chart you pull up on your phone or flip open in a service manual is more than just a grid of numbers. It’s the culmination of over a century of innovation, trial-and-error, and environmental course-correction in the world of refrigeration. Understanding this journey gives you a better appreciation for the tools we rely on every single day.
It all started back in the mid-1800s with "natural" refrigerants like ammonia and carbon dioxide. These compounds worked, but they were also toxic and flammable—a dangerous combination. The industry quickly realized the need for safer, more stable synthetic alternatives to improve both safety and system performance. This search gave rise to chlorofluorocarbons (CFCs) and, later, hydrochlorofluorocarbons (HCFCs), which became the go-to refrigerants for decades. But as we later discovered, their stability came at a steep environmental price: a high ozone depletion potential (ODP).
From Regulation to Innovation
The real game-changer was the 1987 Montreal Protocol. This international treaty wasn't just another regulation; it triggered a global phase-out of ozone-depleting substances and completely reshaped the HVACR industry.
The Montreal Protocol forced a massive pivot away from chemicals that were harming the planet. It sparked a wave of innovation that wasn't just about finding one-to-one replacements. Instead, it forced us to rethink everything—efficiency, safety, and the long-term environmental footprint of our work.
This regulatory push accelerated the move to hydrofluorocarbons (HFCs), which have an ODP of zero. The industry has been in a constant state of flux ever since. From the early days of ammonia and sulfur dioxide, which defined the first vapor-compression systems, to the phase-out of synthetics and the adoption of HFCs, the evolution has been swift. You can dig deeper into this fascinating timeline with a look at the history of refrigerants from REHVA.
Because of this constant change, the refrigerant pressure temp chart is a living document. Every time a new refrigerant is introduced—from widely used HFCs like R-410A to the newer, low-GWP hydrofluoroolefins (HFOs)—it brings its own distinct set of thermodynamic properties. That means it gets its own, unique PT chart. For any tech in the field, using the right chart for the right refrigerant isn't just a best practice; it's absolutely critical for safety, performance, and compliance.
Common Questions About Refrigerant Charts
Even the most experienced techs run into questions when using a refrigerant pressure-temperature chart, especially when you’re up against newer blends or a really old piece of equipment. Let's clear up some of the most common points of confusion so you can use these charts with confidence out in the field.
What's the Real Difference Between Bubble Point and Dew Point?
This is probably the biggest hurdle for technicians getting used to modern refrigerant blends. It’s pretty simple once you get the hang of it. For a zeotropic blend, the bubble point is the temperature where the liquid first starts to boil. On the flip side, the dew point is the temperature where the vapor first starts to condense.
Here’s the rule of thumb you need to remember: always use the bubble point (liquid saturation) when you're calculating subcooling. For superheat calculations, you have to use the dew point (vapor saturation). Getting these two mixed up will throw off your diagnostics every single time.
How Can I Find a Chart for an Old or Obsolete Refrigerant?
So, what do you do when you run into an ancient unit with a refrigerant you haven't seen in years? Finding a reliable refrigerant pressure-temperature chart for older or obsolete refrigerants can feel like a treasure hunt.
Your best bet is to start with digital tools. Many modern HVAC apps and manufacturer websites keep a deep library of PT charts for their legacy products.
If you strike out with digital searches, try these resources:
Archived Service Manuals: Check the original service literature for the unit. Manufacturers almost always included a PT chart for the factory refrigerant.
Industry Forums: Don't underestimate the collective knowledge of veteran technicians. Someone in an online HVAC community has likely run into the same problem and has the chart you need.
Refrigerant Supplier Data: The companies that make or reclaim refrigerants are the ultimate source. They typically have detailed thermodynamic data sheets for all their products, past and present.
Why Does Ambient Temperature Affect My Pressures So Much?
This question comes up all the time. The outdoor air temperature has a massive impact on the condenser's ability to do its job, which is to get rid of heat. On a scorching hot day, the condenser struggles to dump heat into the already-warm air, causing your head pressure to climb.
On a cool day, the opposite happens. The system can easily reject heat, which results in a lower head pressure. This is precisely why there's no such thing as a single "normal" pressure reading—your target pressures will always shift based on the ambient conditions.
Article created using Outrank
A refrigerant pressure-temp chart is one of the most fundamental tools in an HVAC technician's arsenal. At a glance, it maps out the precise relationship between a refrigerant's pressure and its boiling point, which we call its saturation temperature. Technicians depend on these charts for everything from charging a system correctly to diagnosing tricky performance issues and verifying overall efficiency.
How to Read a PT Chart
Think of a PT chart as your decoder ring for what's happening inside the sealed refrigerant circuit. It takes the complex laws of thermodynamics and makes them practical for fieldwork. The core principle is simple: for any given refrigerant, if you know its pressure while it's in a saturated state (a mix of liquid and vapor), you know its exact temperature. The reverse is also true.
This connection is the bedrock of professional diagnostics. Trying to service a system without this data is like flying blind; you’re just guessing. The chart is what allows us to calculate superheat and subcooling—the two most vital signs of a system's health. These calculations tell you whether the refrigerant charge is correct and if critical components like the expansion valve and compressor are doing their job.
Key HVAC Terms and Definitions
Before we dive deeper into using the chart, you need to be comfortable with a few key terms. Each one describes a specific state or process happening to the refrigerant inside the system. Getting these concepts down is the first step to making accurate calculations and diagnoses.
Pro Tip: Always double-check that you're using the PT chart that matches the exact refrigerant in the system. Using an R-22 chart for an R-410A system, for example, will throw off all your readings and could lead to misdiagnosis or even equipment damage.
Here's a quick-reference table of the terms you'll see again and again.
Term | Definition |
|---|---|
Saturation | This is the state where refrigerant is actively changing from a liquid to a gas (boiling) or a gas to a liquid (condensing). In this state, both liquid and vapor are present at the same temperature and pressure. |
PSIG | Stands for Pounds per Square Inch Gauge. It's the pressure reading relative to the atmosphere around you and is the standard measurement you'll see on your HVAC manifold gauges. |
Superheat | This is the temperature added to the refrigerant vapor after all the liquid has boiled off. Measuring superheat confirms the evaporator coil is working efficiently and protecting the compressor from liquid. |
Subcooling | This is the temperature removed from the refrigerant liquid after all the vapor has condensed. A proper subcooling reading ensures a solid stream of liquid is being delivered to the metering device. |
Getting a firm grasp on these definitions is non-negotiable for anyone working in the field. They are the language of refrigeration, and we'll be applying them in practical scenarios throughout this guide.
The Science Behind Refrigeration and PT Charts
At its core, a refrigerant pressure-temperature chart is a cheat sheet for the laws of thermodynamics in action. It’s the tool that lets us peek inside an AC or refrigeration system and see what’s really going on. The entire chart is built on one simple, reliable principle: for a given refrigerant, its boiling point is directly tied to its pressure. Change one, and the other changes in a predictable way.
This relationship is the foundation of how these systems move heat. The real work gets done during the phase change—when the refrigerant turns from a liquid to a gas and back again. This continuous process, known as the vapor-compression cycle, is what allows an air conditioner to absorb heat from inside your house and dump it outside.
The Four Stages of the Refrigeration Cycle
Every system, from a small window unit to a massive commercial chiller, runs on this same four-stage cycle. A PT chart is your go-to reference for two of these stages—the ones where the magic of phase change happens.
Evaporation: This is where the cooling happens. Inside the evaporator coil (the indoor unit), the cold, low-pressure liquid refrigerant boils. As it boils, it absorbs a massive amount of heat from the indoor air, turning from a liquid into a gas. Your PT chart tells you the exact temperature this should be happening at based on your low-side pressure reading.
Compression: Now a low-pressure gas, the refrigerant travels to the compressor. The compressor, as the name implies, squeezes this gas, which dramatically increases its pressure and, as a result, its temperature. It leaves the compressor as a very hot, high-pressure, superheated vapor.
Condensation: This hot gas then flows to the condenser coil (the outdoor unit). Here, it releases all the heat it picked up inside. As it cools down to its saturation point, it condenses back into a high-pressure liquid. Once again, the PT chart confirms the exact temperature this phase change should occur at, based on your high-side pressure reading.
Expansion: Finally, this high-pressure liquid passes through an expansion device. This device acts like a nozzle, causing a sudden drop in pressure and temperature. The refrigerant is now a cold, low-pressure liquid, ready to head back to the evaporator and start the whole process over.
It's this constant cycle of boiling and condensing that makes cooling possible. The PT chart is indispensable because it gives you a direct, accurate link between a refrigerant's saturation pressure and its corresponding saturation temperature. Classic charts list vapor pressure in psig alongside temperature, built on the idea that single-component refrigerants have one specific boiling point for any given pressure. For a deeper dive into how this all works together, you can find some great refrigeration cycle insights from APC.com.
How to Read and Apply a PT Chart Accurately
Think of a refrigerant pressure-temperature chart as your map to a system's inner workings. It's an indispensable tool, but only if you know how to read it right. Get this wrong, and your entire diagnosis can go sideways. The process itself is pretty straightforward: you take one known value—either pressure from your gauges or a temperature you've measured—and use the chart to find its corresponding state.
First things first, make sure you're looking at the right chart for the refrigerant in the system you're servicing. A chart for R-22 is useless if the unit runs on R-410A. Once you’ve got the right one, hook up your gauges. Let's say you get a low-side pressure reading. Find that pressure (in PSIG) on the chart, and the temperature right next to it is the refrigerant's saturation temperature—the exact point where it’s boiling off inside the evaporator.
This simple cross-reference is the foundation of almost every diagnostic you'll perform. It lets you confirm if the system is hitting the saturation points it should be. For instance, if you know the target evaporator temperature should be hovering around 40°F, the chart will tell you the precise low-side pressure you should be seeing on your gauges to make that happen.
From Saturation to Superheat and Subcooling
Finding the saturation temperature is just step one. The real diagnostic magic happens when you use that number to calculate superheat and subcooling. These two values are the most critical vital signs for any vapor-compression system, telling you what the refrigerant is doing after it has finished changing state.
Superheat and subcooling aren't just abstract numbers; they're direct clues to system efficiency and component health. The wrong superheat can scream "undercharged system" or "bad TXV," while incorrect subcooling often points to an overcharge or a liquid line restriction.
To get these crucial figures, you'll compare the saturation temperature from the chart with an actual temperature you measure on the refrigerant lines. Here’s how you do it for both.
Quick Lookup for Common Refrigerant Saturation Points
For a quick reference on the job, it helps to have a few common saturation points memorized. This table shows the relationship for some of the most common refrigerants you'll encounter at typical operating temperatures. It's a great example of how you can use a full PT chart for a fast gut check in the field.
Refrigerant | Saturation Temperature (°F) | Corresponding Pressure (PSIG) |
|---|---|---|
R-410A | 40°F | ~118 PSIG |
R-134a | 35°F | ~30 PSIG |
R-22 | 45°F | ~76 PSIG |
R-404A | 10°F | ~48 PSIG |
This kind of quick lookup helps you immediately spot if a pressure reading is way out of the expected range, prompting a deeper investigation.
Calculating Superheat
Measure Suction Line Pressure: Hook up your low-side gauge to the suction port near the compressor and note the pressure in PSIG.
Find Saturation Temperature: Look up that pressure on your refrigerant pressure temp chart to find the corresponding boiling temperature.
Measure Suction Line Temperature: Using a good quality pipe clamp thermometer, measure the temperature on the suction line at the exact same spot you took the pressure reading.
Do the Math: Subtract the saturation temperature (from the chart) from the actual line temperature you measured. The result is your superheat.
Example:
You're working on an R-410A system and your low-side gauge reads 118 PSIG.
The PT chart tells you the saturation temp for 118 PSIG is 40°F.
Your pipe clamp on the suction line reads 50°F.
The calculation: 50°F (actual temp) - 40°F (saturation temp) = 10°F of Superheat.
Calculating Subcooling
Measure Liquid Line Pressure: Attach your high-side gauge to the liquid line service port and record the pressure.
Find Saturation Temperature: Use your PT chart to find the saturation (condensing) temperature that corresponds to that high-side pressure.
Measure Liquid Line Temperature: Clamp your thermometer onto the liquid line, again, as close as possible to the service port.
Do the Math: This time, you subtract the actual line temperature you measured from the saturation temperature on the chart. That value is your subcooling.
Following this methodical process turns a simple refrigerant pressure temp chart from a static reference sheet into a powerful, active diagnostic tool. Getting these fundamental readings right is the key to effective service, whether you're troubleshooting a charge or confirming the performance of system components like pressure transducers and metering devices.
Using PT Charts for Real-World HVAC Diagnostics
A refrigerant pressure-temperature chart stops being just a reference document and becomes one of your most powerful diagnostic tools the second you hook up your gauges in the field. Knowing the theory is one thing, but applying that chart to figure out what's really going on inside a struggling system is what separates the pros from the newcomers. Armed with your manifold gauges and a good thermometer, the PT chart helps you uncover the hidden story of a system's health.
The process itself is straightforward and incredibly reliable. For any given pressure, the chart tells you the exact temperature at which that refrigerant should be boiling or condensing—its saturation point. When you compare that expected temperature to the actual temperatures you measure on the system's lines, the difference tells you everything you need to know.
This simple workflow is the core of refrigerant-side diagnostics.
As the infographic shows, it all starts with identifying the refrigerant. From there, you take a pressure reading, find the corresponding saturation temperature on your chart, and use that value as the baseline for all your other checks.
Calculating Superheat to Diagnose System Performance
Superheat is your window into what's happening in the evaporator coil. It tells you how efficiently the coil is absorbing heat and, just as importantly, whether you're sending safe, vapor-only refrigerant back to the compressor. If your superheat is off, it's a major red flag, almost always pointing to an incorrect refrigerant charge or a problem with the metering device.
To find it, you just need to compare the evaporator's boiling point (which you get from the PT chart) with the actual temperature of the vapor leaving the coil.
Example Scenario: An Undercharged System
Refrigerant: R-410A
Low-Side Pressure: You hook up your gauges and get a reading of 100 PSIG on the suction line.
Chart Value: A quick look at your R-410A PT chart shows that 100 PSIG equates to a saturation (boiling) temperature of 32°F.
Actual Temperature: You place your pipe clamp thermometer on the suction line near the outdoor unit and get a reading of 55°F.
Calculation: 55°F (Actual Temp) – 32°F (Saturation Temp) = 23°F of Superheat.
A superheat of 23°F is almost always too high. It's a classic sign that there isn't enough liquid refrigerant boiling in the evaporator to effectively absorb heat, strongly suggesting the system is undercharged or has a leak.
Calculating Subcooling to Find Charge and Flow Issues
Subcooling, on the other hand, tells you about the state of the refrigerant in the liquid line. It confirms whether the condenser successfully removed enough heat to turn all the high-pressure vapor into a solid column of liquid. An incorrect subcooling value often means you're dealing with an overcharge or a restriction somewhere before the metering device.
A proper subcooling reading is absolutely critical. Without a solid stream of liquid refrigerant, the expansion valve can't feed the evaporator correctly. This starves the coil, leading to poor performance and even component damage down the line.
Example Scenario: An Overcharged System
Refrigerant: R-410A
High-Side Pressure: Your high-side gauge reads 418 PSIG.
Chart Value: Your PT chart shows that a pressure of 418 PSIG corresponds to a saturation (condensing) temperature of 120°F.
Actual Temperature: You measure the liquid line temperature right before it enters the building and get 100°F.
Calculation: 120°F (Saturation Temp) – 100°F (Actual Temp) = 20°F of Subcooling.
A subcooling of 20°F is significantly higher than the typical manufacturer's target (which is usually around 10–12°F). This excess cooling means refrigerant is stacking up in the condenser instead of flowing through the system—the textbook definition of an overcharge.
Getting comfortable with these quick calculations is key. It's the same fundamental data that more advanced tools, like pressure chart recorders, use to track and log system performance over time.
Understanding Blends and Temperature Glide on Modern PT Charts
If you've been in the trade for a while, you know that reading a PT chart for a single-component refrigerant like R-22 is second nature. But today’s systems often run on zeotropic blends, like R-407C, which behave differently. To get accurate readings with these, you have to master a new concept: temperature glide.
A pure refrigerant boils and condenses at one specific temperature for a given pressure. A zeotropic blend, however, changes state across a range of temperatures. This phenomenon is what we call temperature glide, and it can span anywhere from 1°F to over 5°F.
This happens because the different components within the blend boil and condense at slightly different rates, a process known as fractionation. The result? Modern PT charts for blends need two separate columns for saturation temperature—one for the dew point (vapor) and one for the bubble point (liquid). You can find a deeper dive into how refrigerant blends work at APC.com to learn more about the science behind it.
Put simply, at a single pressure inside the evaporator coil, the refrigerant starts boiling at one temperature and doesn't finish until it reaches a higher one. This is exactly why you'll see two temperature columns next to each pressure reading on a modern chart.
Bubble Point vs. Dew Point
So, which temperature do you use? Getting this wrong is a fast track to miscalculating your superheat or subcooling, leading you to a completely flawed diagnosis. It’s critical to match the right value to the state of the refrigerant.
Bubble Point: This is the temperature where the liquid refrigerant starts to boil. Think of it as the "saturated liquid" temperature. It will always be the lower of the two temperature values on the chart.
Dew Point: This is the temperature where the last bit of refrigerant vapor finally condenses into a liquid. This is your "saturated vapor" temperature and will always be the higher of the two values.
There’s a simple rule of thumb that you absolutely have to remember: always use the temperature that matches the state of the refrigerant after the phase change is complete.
Here’s how that plays out in the field:
For Superheat: You measure superheat on the suction line, where the refrigerant should be 100% vapor. Therefore, you must use the Dew Point (vapor saturation) temperature from your PT chart.
For Subcooling: You measure subcooling on the liquid line, where the refrigerant should be 100% liquid. For this, you have to use the Bubble Point (liquid saturation) temperature.
A Brief History of Refrigerants and Their Charts
The pressure-temperature chart you pull up on your phone or flip open in a service manual is more than just a grid of numbers. It’s the culmination of over a century of innovation, trial-and-error, and environmental course-correction in the world of refrigeration. Understanding this journey gives you a better appreciation for the tools we rely on every single day.
It all started back in the mid-1800s with "natural" refrigerants like ammonia and carbon dioxide. These compounds worked, but they were also toxic and flammable—a dangerous combination. The industry quickly realized the need for safer, more stable synthetic alternatives to improve both safety and system performance. This search gave rise to chlorofluorocarbons (CFCs) and, later, hydrochlorofluorocarbons (HCFCs), which became the go-to refrigerants for decades. But as we later discovered, their stability came at a steep environmental price: a high ozone depletion potential (ODP).
From Regulation to Innovation
The real game-changer was the 1987 Montreal Protocol. This international treaty wasn't just another regulation; it triggered a global phase-out of ozone-depleting substances and completely reshaped the HVACR industry.
The Montreal Protocol forced a massive pivot away from chemicals that were harming the planet. It sparked a wave of innovation that wasn't just about finding one-to-one replacements. Instead, it forced us to rethink everything—efficiency, safety, and the long-term environmental footprint of our work.
This regulatory push accelerated the move to hydrofluorocarbons (HFCs), which have an ODP of zero. The industry has been in a constant state of flux ever since. From the early days of ammonia and sulfur dioxide, which defined the first vapor-compression systems, to the phase-out of synthetics and the adoption of HFCs, the evolution has been swift. You can dig deeper into this fascinating timeline with a look at the history of refrigerants from REHVA.
Because of this constant change, the refrigerant pressure temp chart is a living document. Every time a new refrigerant is introduced—from widely used HFCs like R-410A to the newer, low-GWP hydrofluoroolefins (HFOs)—it brings its own distinct set of thermodynamic properties. That means it gets its own, unique PT chart. For any tech in the field, using the right chart for the right refrigerant isn't just a best practice; it's absolutely critical for safety, performance, and compliance.
Common Questions About Refrigerant Charts
Even the most experienced techs run into questions when using a refrigerant pressure-temperature chart, especially when you’re up against newer blends or a really old piece of equipment. Let's clear up some of the most common points of confusion so you can use these charts with confidence out in the field.
What's the Real Difference Between Bubble Point and Dew Point?
This is probably the biggest hurdle for technicians getting used to modern refrigerant blends. It’s pretty simple once you get the hang of it. For a zeotropic blend, the bubble point is the temperature where the liquid first starts to boil. On the flip side, the dew point is the temperature where the vapor first starts to condense.
Here’s the rule of thumb you need to remember: always use the bubble point (liquid saturation) when you're calculating subcooling. For superheat calculations, you have to use the dew point (vapor saturation). Getting these two mixed up will throw off your diagnostics every single time.
How Can I Find a Chart for an Old or Obsolete Refrigerant?
So, what do you do when you run into an ancient unit with a refrigerant you haven't seen in years? Finding a reliable refrigerant pressure-temperature chart for older or obsolete refrigerants can feel like a treasure hunt.
Your best bet is to start with digital tools. Many modern HVAC apps and manufacturer websites keep a deep library of PT charts for their legacy products.
If you strike out with digital searches, try these resources:
Archived Service Manuals: Check the original service literature for the unit. Manufacturers almost always included a PT chart for the factory refrigerant.
Industry Forums: Don't underestimate the collective knowledge of veteran technicians. Someone in an online HVAC community has likely run into the same problem and has the chart you need.
Refrigerant Supplier Data: The companies that make or reclaim refrigerants are the ultimate source. They typically have detailed thermodynamic data sheets for all their products, past and present.
Why Does Ambient Temperature Affect My Pressures So Much?
This question comes up all the time. The outdoor air temperature has a massive impact on the condenser's ability to do its job, which is to get rid of heat. On a scorching hot day, the condenser struggles to dump heat into the already-warm air, causing your head pressure to climb.
On a cool day, the opposite happens. The system can easily reject heat, which results in a lower head pressure. This is precisely why there's no such thing as a single "normal" pressure reading—your target pressures will always shift based on the ambient conditions.
Article created using Outrank
Related Articles
Read more from our blog
What Is a VFD in HVAC? A Practical Explainer
What Is a VFD in HVAC? A Practical Explainer
What is a VFD in HVAC? Learn how Variable Frequency Drives work, their key benefits for energy savings, and their most common applications in modern buildings.
August 7, 2025
August 7, 2025
August 7, 2025

How to Read HVAC Wiring Diagrams: A Complete Guide
How to Read HVAC Wiring Diagrams: A Complete Guide
Learn how to read HVAC wiring diagrams with our easy-to-follow guide. Master wiring diagrams quickly and confidently. Click to become an expert!
August 8, 2025
August 8, 2025
August 8, 2025

13263 SW 124th St. Miami, FL 33186
Ph: (305) 510-0626
Email: info@epscontrols.com
Hours: Monday - Friday
9:00am - 5:00pm EST
13263 SW 124th St. Miami, FL 33186
Ph: (305) 510-0626
Email: info@epscontrols.com
Hours: Monday - Friday
9:00am - 5:00pm EST
13263 SW 124th St. Miami, FL 33186
Ph: (305) 510-0626
Email: info@epscontrols.com